Where the Next Fire Starts
Research (ongoing)A daily multi-modal datacube over Washington State, and a spatiotemporal model that reads it, asking whether a wildfire ignition is predictable before it happens and from what.
I was born and raised in Kirkland, Washington (USA) in the early 2000s. In my teenage years, fires didn't seem all that common. My family owned a cabin up in Cle Elum, WA and also frequented Winthrop, WA, and I can only remember one summer that we decided not to visit Winthrop due to fires. Frankly, I was a naive kid, but it also wasn't something that hit the newsline all that often.
These days fire is everywhere. It is a stretch of the calendar when the light goes orange, the air smells like a campfire nobody lit, and the mountains go missing for days. The east side burns. The west side fills with smoke that started somewhere else entirely. Every August the conversation is the same conversation about whether this year is worse than last.
I'm a Machine Learning engineer because problems like these, the ones that hit close to home, become something I can actually do something about.
What to do about it?
For every cell of a Washington State grid, on every day of the season: how likely is it that a new fire starts here in the coming week, and if one does, what lit it?
That is the whole of the target. Not how far the fire runs, not how large it gets, not what it destroys. Onset, and cause.
This is a solo study and it is in flight. The data pipeline is written, the datacube is built, and the model is implemented and trains end to end. No evaluated result exists yet, so none is reported below.
The cold truth
Fire modeling is HARD.
The obvious problem is that fires, when looking at all days at all locations, are really really rare. The probability a given 1km cell has a new ignition within a 7-day window during peak fire season (May 1 to Oct 31) is 0.035%-0.045%. A model predicting no fire everywhere is correct nearly all of the time, a model predicting fire all the time is equally useless. Every downstream decision in a project has to de-sensitize this.
Zoom out to the land base and the rarity holds. Washington has about 22 million acres of forestland. On the lands the state itself protects, the ten-year average is 104,285 acres burned per year, under half a percent of it. Annual totals across the 2012 to 2023 record swing from 97,461 acres to 1,281,797, a factor of thirteen, and even 2017, the worst of those years, came to under 6% of the state's forestland. The Carlton Complex in 2014, the largest single fire in Washington's recorded history, covered roughly 1.2% of it.
Among the fires that do start, size is fat-tailed. Western Washington logged 101 fires in the 2023 season. Sixty-six stayed under five acres, nine got past a hundred, and two of them accounted for 83% of everything that burned. In 2022 the state held more than 94% of its starts to ten acres or smaller. Most ignitions never become what people mean when they say wildfire, and the handful that do carry nearly all of the damage.
The less obvious reason is that the drivers behind fire don't compose linearly. Drought with no fuel means no fire. Fuel with nothing to light it also means no fire. A dry, windy ridge near a town is a different object than the same ridge deep in wilderness.
Ignition source is its own moving part, and it is where this topic gets misread most often. The share of fires that are human-caused and the share of acres that are human-caused point in opposite directions. Nationally, across 1992 to 2012, people started 84% of fires but only 44% of the acreage, while lightning started 16% of fires and 56% of the acreage. The mechanism is geographic. People ignite near roads and towns where a fire gets caught small; lightning strikes back in terrain nobody can reach quickly, and it burns a while before anyone tries. Lightning's share of acres isn't stable either, running from 43% in a mild year to 80% in a severe one, and Washington's lightning share of ignitions halved between 2022 and 2023, from about 18% to 9%, with no comparable halving of drought.
Which is the part that makes this worth modeling at all: drought raises risk without deciding the outcome. 2023 in Washington ran above-average hot and below-normal wet statewide, textbook fire conditions, and finished as one of the lowest-acreage seasons in the record because three precipitation events happened to land at the right times. The 2020 Labor Day outbreak went the other way. A rare reversed wind pattern out of British Columbia, gusting 35 to 50 mph against the normal west-to-east flow, put more than 330,000 acres down in roughly a day and started new fires off downed power lines while it did it. Dryness was the background condition. The wind was the trigger. Even the most-cited attribution work in the field puts anthropogenic climate change at about half of the cumulative area burned across western US forests from 1984 to 2015, and says plainly that the rest belongs to natural variability, suppression legacy, land management, and where people chose to live.
So roads, housing, and the wildland-urban interface belong in the same tensor as vapor pressure deficit and convective activity. It is exactly the join that no single data product is built to support, and it is why the harmonization step is the project rather than a preliminary to it. The interaction is the signal, which means a model has to be allowed to learn across the feature axis and not only across space and time.
The datacube
The observations that would tell you where risk concentrates already exist, publicly, and have for decades. They are scattered across archives run by agencies that never intended their products to be read together: different resolutions, different projections, different calendars, some updated daily and some once a decade. Nobody is funded to make them talk to each other for one state. That is a data and modeling problem, and it is the part I can actually do.
Each source arrives in its own frame. Satellite vegetation composites land every week or two. Meteorology is daily. Terrain is effectively fixed. Settlement patterns move on a decadal census. Fire records are points and polygons, not rasters at all.
The build reprojects every product onto one shared Washington grid, places each on a common daily time axis under an interpolation rule chosen per variable rather than one rule imposed on everything, and then derives the channels that only become computable once the sources are aligned. Supervision covers the May through October season across 2003 to 2020, which is where Washington's fires actually are.
The cubes come out at three grid spacings, 1km, 2km, and 4km. They carry no train, validation, or test boundary, so my split choice is not baked into them. They live on Hugging Face.
The most defensible thing this project produces may not turn out to be the model. It may be the datacube.
What would count as working
Two things, and neither of them is an accuracy score.
First, the model has to beat the calendar and the map. Anyone can forecast Washington's fires by knowing that August is worse than May and that the dry side burns more than the wet side. If the model cannot resolve uncertainty past what seasonality and location already give you for free, it has learned nothing worth having, however good its raw numbers look against a rare-event baseline.
Second, the probabilities have to mean what they say. A field that ranks cells correctly but reports numbers nobody can act on is a research artifact, not a tool. If a cell reads one in a thousand, then across many cells reading one in a thousand, about one should burn.
Both tests, and the thresholds that decide them, were fixed before any trained checkpoint existed. That ordering is deliberate: it is the only way to stop a result I happen to like from retroactively becoming the bar I set for myself.
What it will not tell you
Occurrence only. If the finished model works, it says a fire is more likely to start in this cell, this week, than in that one. It says nothing about how far that fire runs, how large it grows, how hot it burns, or what it reaches. Those are separate problems with separate data and separate physics, and an ignition map read as a burn-probability map is worse than no map at all.
Cause is conditional in the same way. The question is what kind of ignition it was, given that something ignited. It is not a claim that cause is knowable in advance.
Contact me for more
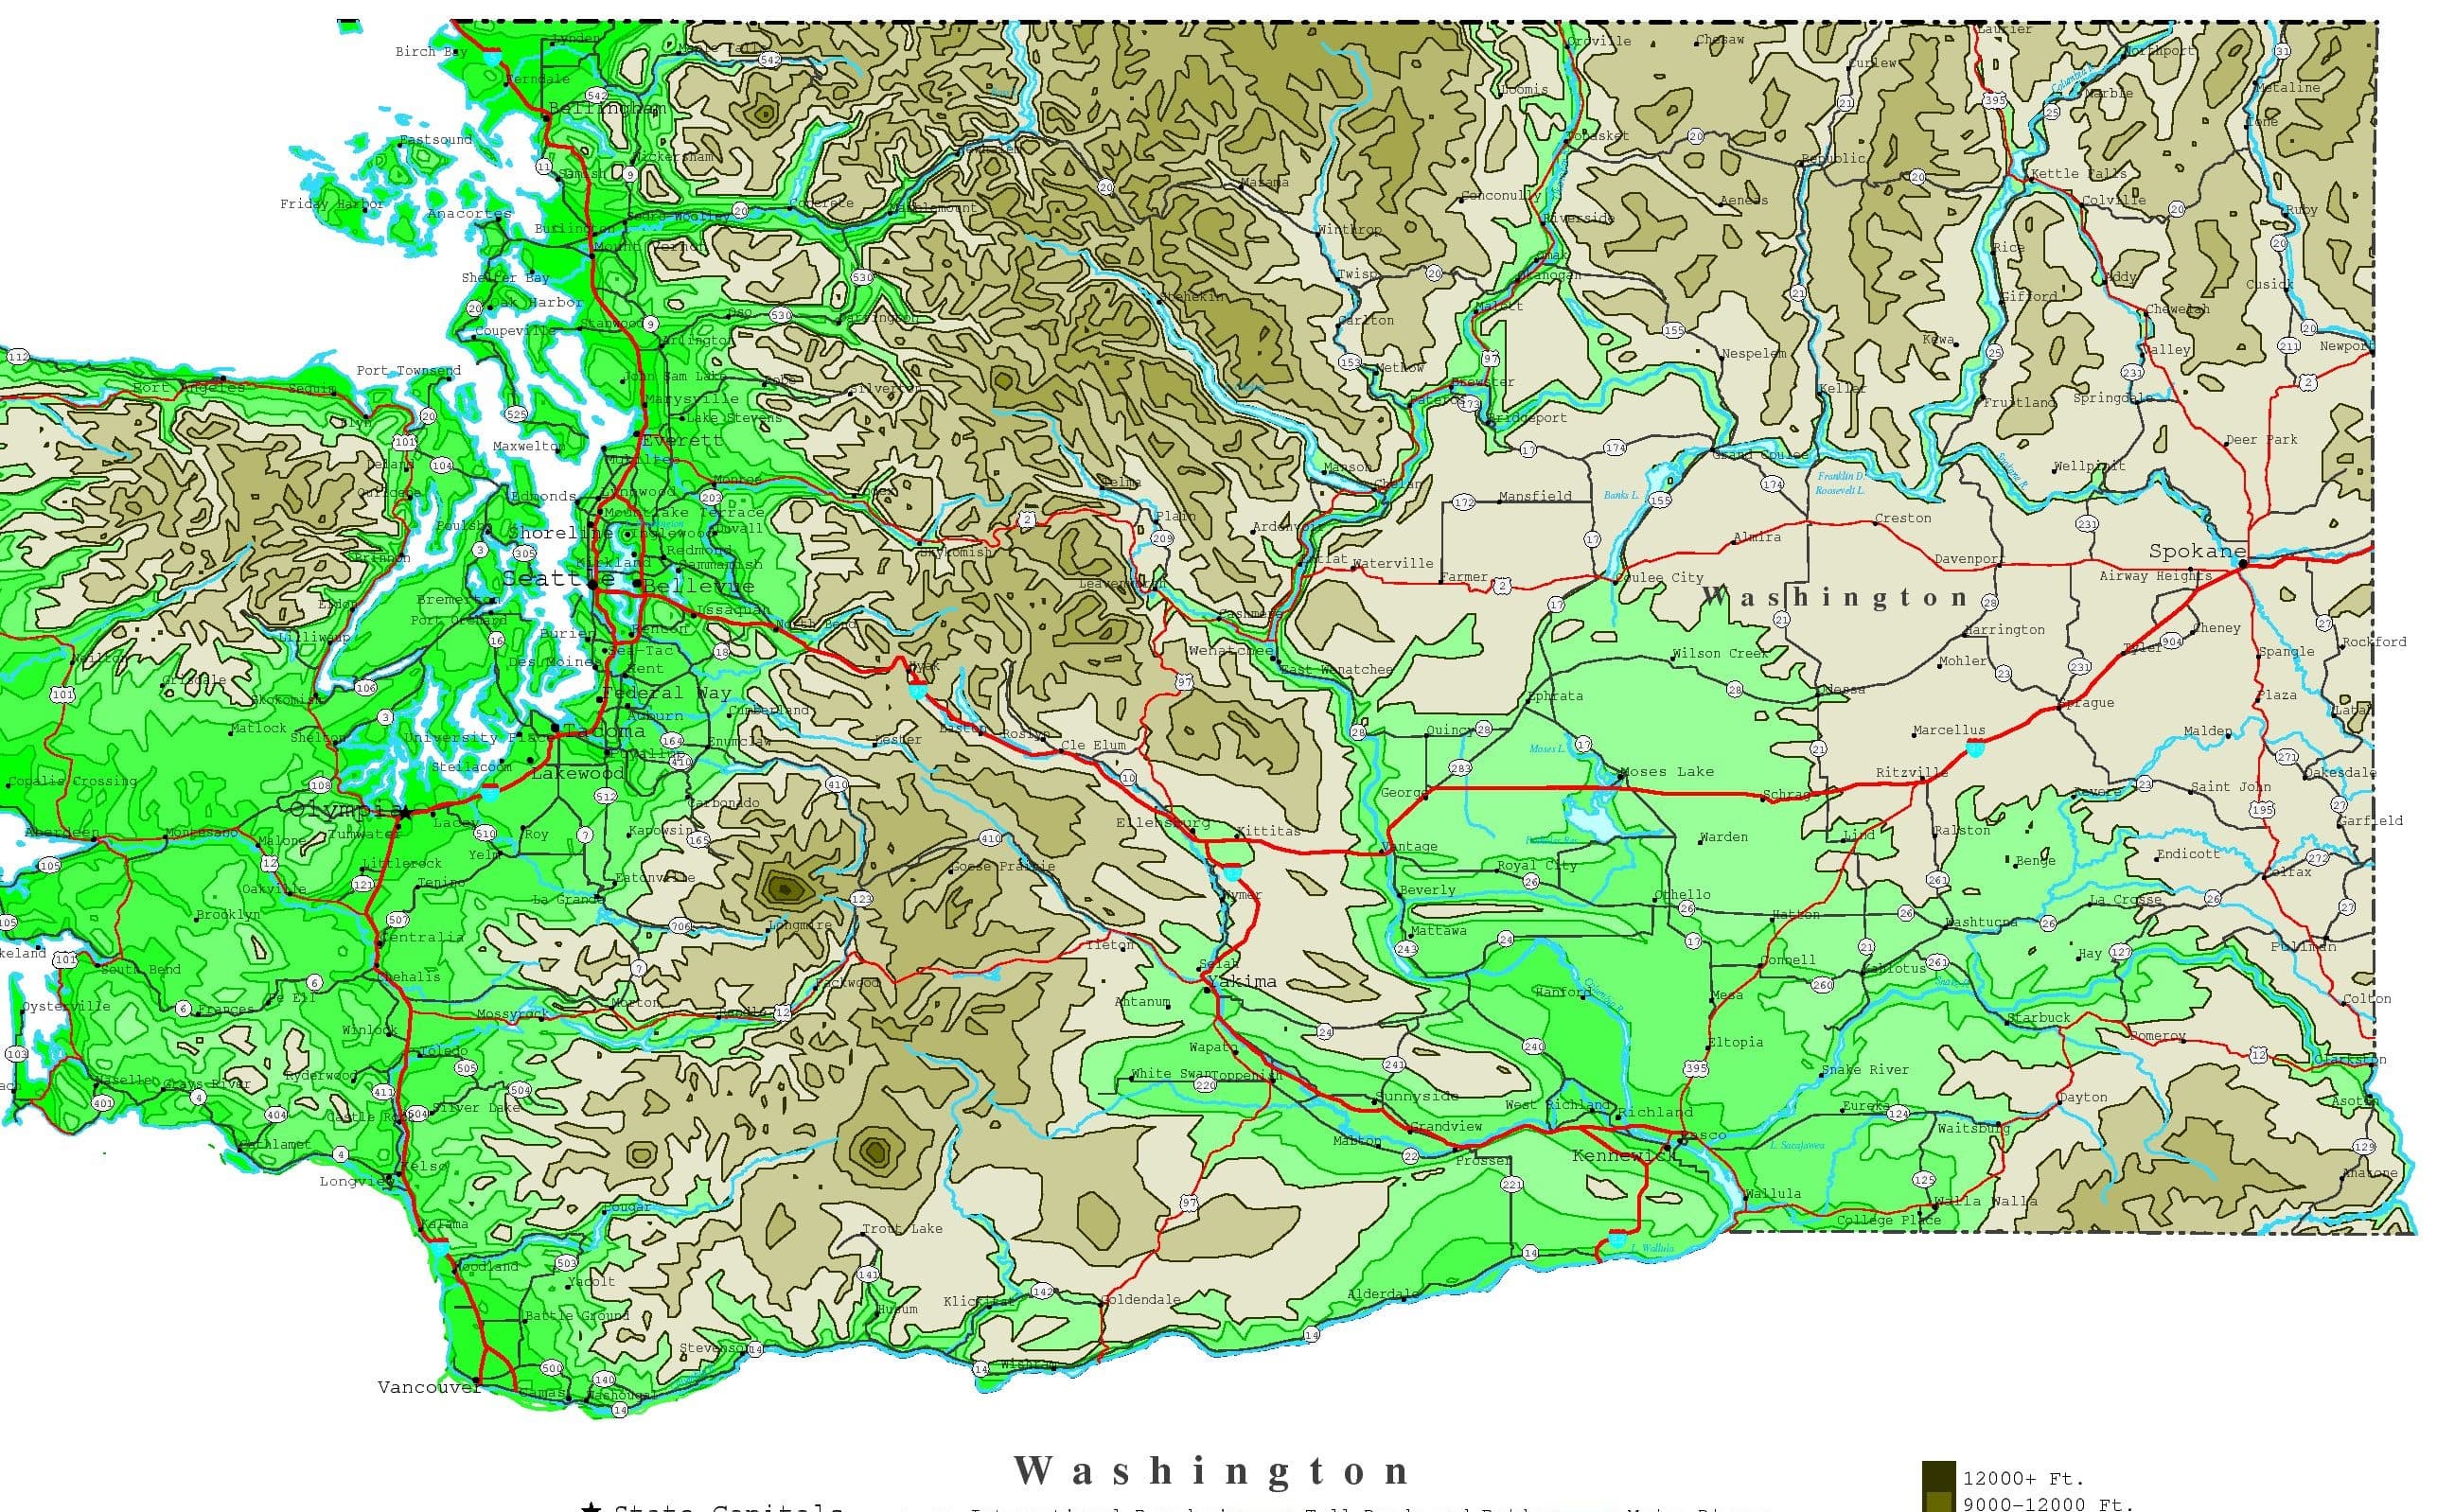
The picture at the top of this page is a map of Washington. It is not a model output, and I am not going to put one there until there is one I can stand behind. Results will show up here when they exist and can be defended. Until then, if you'd like to hear more about the setup or the cube, contact me.